Understanding Home usage data
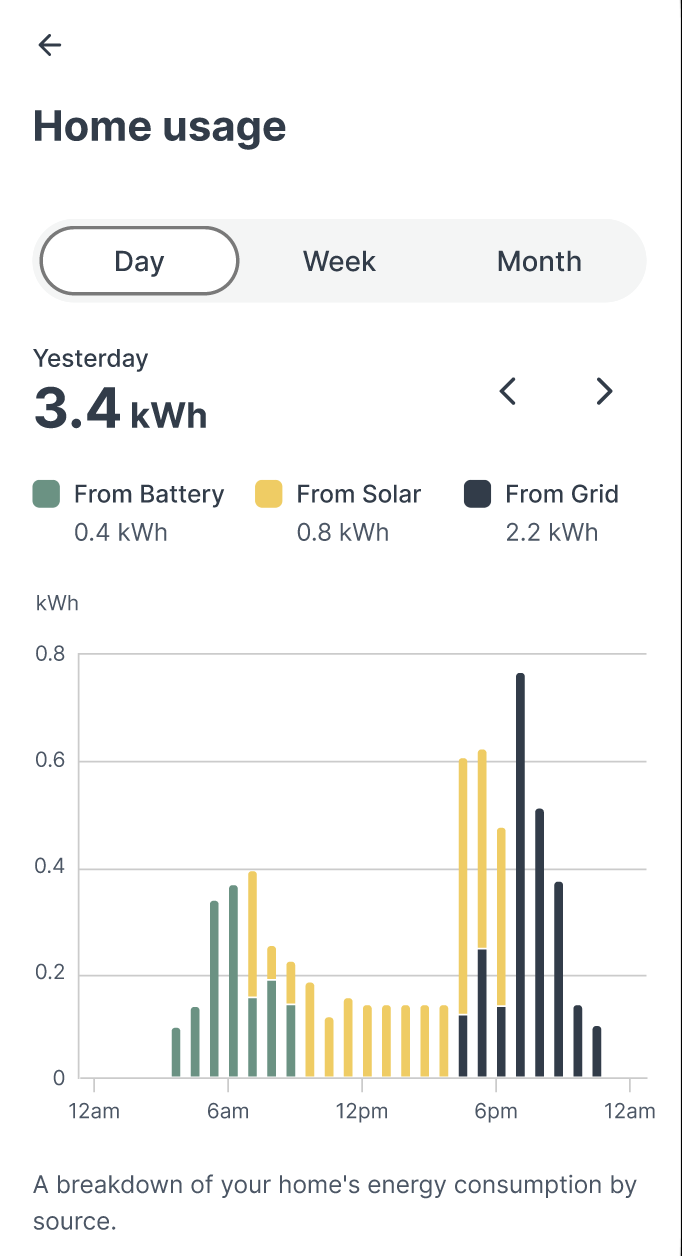
The Home usage chart helps consumers to monitor their energy consumption patterns, optimise their usage, and work towards achieving energy self-sufficiency. They can also give an indication of potential device issues, for example if the solar generation doesn’t look as expected.
How do we get usage data?
We get access to PV generation data, battery data, and grid import/export data. We gather this data through cloud APIs connected to the inverter. Home usage data does not come from the user’s smart meter. It is inferred from a combination of the data that we get from the inverter.
How accurate is the data?
The data we get from the inverter is accurate as long as the hardware has been installed correctly. Usage data might differ slightly from the consumption data a user might get from their smart meter. The difference should be very small.
How is usage calculated?
Home usage data from the inverter does not break down how the home uses energy from different sources. This is calculated using:
Net PV Production (kWh): net solar energy generated
Battery Discharge (kWh): amount of energy discharged from the battery
Battery Charge (kWh): amount of energy being used to charge the battery
Grid Import (kWh): amount of energy being imported from the grid
Grid Export (kWh): amount of energy being sold to the grid
The usage calculations take into account many factors over the day, at a high level it is: (grid import + solar generation + battery discharge) - (grid export + battery charge).
We assume that a home takes the following actions to make these calculations:
A house first uses available PV production
Then the house uses available battery discharge
Finally the house uses energy from the grid
Occasionally homes may take slightly different actions but not in a way that significantly impacts the charts.
How often is the usage and generation data updated in the app?
This can vary by device manufacturer but typically the app receives data every 5 minutes.